


The When, How, Where, and What of Produce Season
Produce season will have a tremendous impact on not just reefer volume, but truckload capacity across the board – and with that, pricing.
Brokers across the country are asking: When will produce season hit (and where), how will this impact capacity, and how much will prices go up as a result of diminished capacity?
When?
Weather can have a huge impact on the viability of crops and how many make it out of a certain region. For example, tomato and strawberry season is set to begin quickly in southern Florida. Those volumes are currently down over 30%. When do we expect those volumes to increase and begin moving northward along their traditional route? Our market updates are a good place to look for answers.
Produce season generally follows an annual south-to-north pattern. In the Southeast, the Miami and Lakeland markets absorb truckload capacity in late April and early May, driving higher rates and attracting trucks from other markets. Retailers restock shelves leading up to Memorial Day, boosting summer shipping of food and beverages. Border cities like McAllen, Laredo, and Miami see increased demand for produce from Mexico and Latin America, impacting outbound spot rates in Texas and the southeast.
By late June, harvests have moved northward, bringing higher demand for refrigerated shipments along with them. Carriers concentrate more capacity in markets like Atlanta, Savannah, and Jacksonville where prices are elevated.
How?
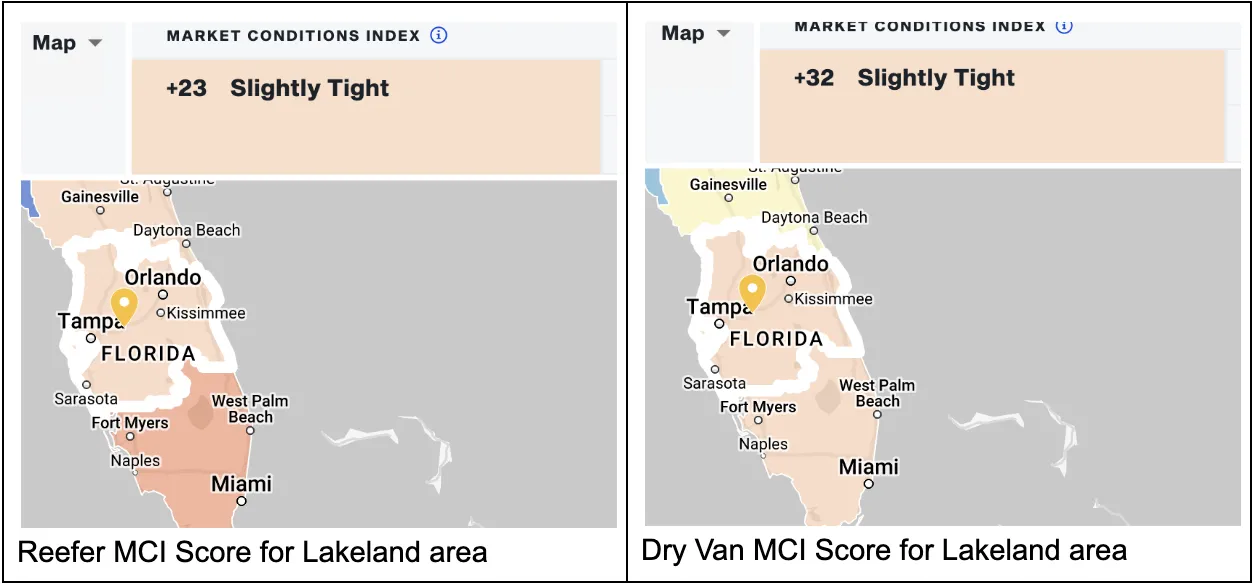
Produce movement out of southern Florida typically means tightening capacity for reefer and dry vans out of Florida. Van capacity also tightens because often when reefers aren’t shipping refrigerated goods, they ship non-refrigerated goods and act as extra capacity.
The table below shows DAT’s Market Conditions Index (MCI) for southern Florida. The MCI scores market tightness or looseness on a -100 to +100 scale, with +100 representing an extremely tight market. Market tightness associated with produce season typically means linehaul costs go up as it's harder to find capacity.
How much?
Finally, the million-dollar question. How much does produce season impact the cost of freight on a given lane? The answer is, potentially, a lot.
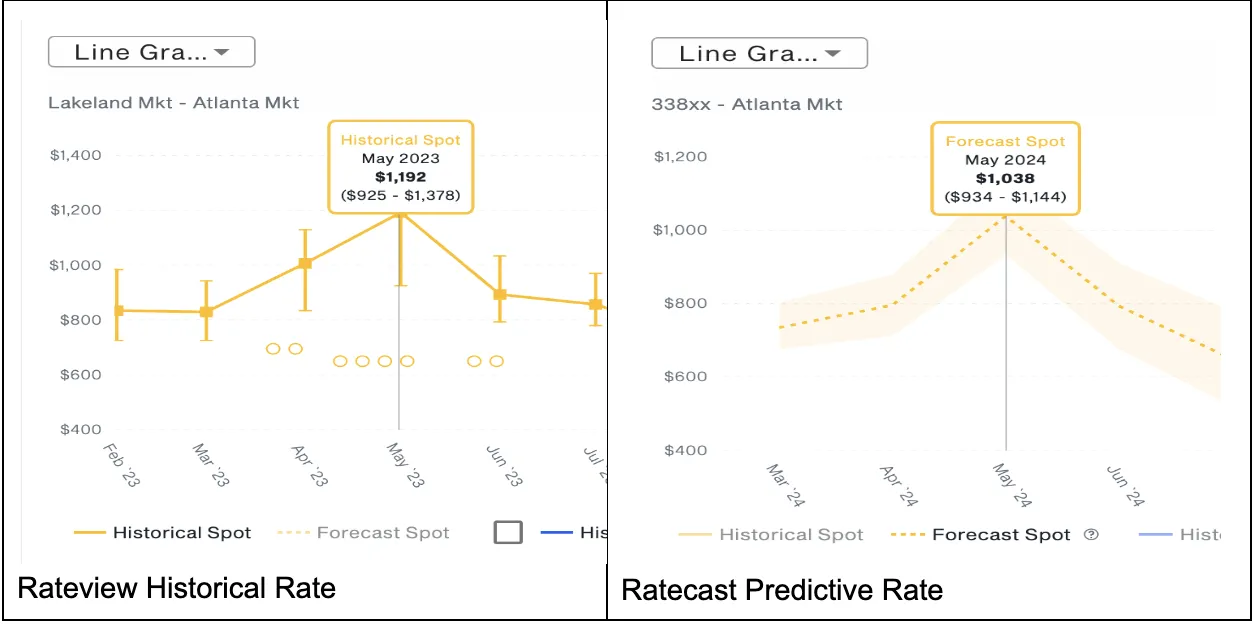
Below are RateView Analytics snapshots from DAT iQ. Both are looking at reefer spot freight from Lakeland, FL, to Atlanta. Historically, starting in March, freight out of Lakeland begins to increase until it crescendos in May. Booked rates increased from an average of $800 to $1,200 – a 50% increase – in 2023.
We are projecting a similar spike this year, with a peak average of $1,038. As you calculate margins, this $162 difference between 2023 and what is projected for 2024 can be the difference between making or losing money.
Planning for produce season can be a daunting task. DAT is here to help. Please reach out to your customer success representative or account manager today for any questions you have.
About DAT Freight & Analytics
DAT Freight & Analytics operates the largest truckload freight marketplace in North America. Shippers, transportation brokers, carriers, news organizations and industry analysts rely on DAT for market trends and data insights based on more than 400 million freight matches and a database of $150 billion in annual market transactions.
The above article is sponsor-generated content. To learn more about sponsor-generated content, click here.